12 Best Network Monitoring Tools for UK Businesses in 2025
In a modern business environment, maintaining a healthy, high-performing network is not merely an IT task; it is fundamental to operational continuity and security. For small and medium-sized enterprises across Dorset, Somerset, Wiltshire, and Hampshire, network downtime or sluggish performance directly impacts productivity, customer service, and ultimately, revenue. Proactive network management is the key to preventing minor issues from escalating into major disruptions.
This guide is designed to help you navigate the complex market and find the best network monitoring tools for your specific requirements. We will move beyond generic feature lists and provide a detailed analysis of 12 leading platforms. Each review is structured to deliver practical insights, focusing on real-world use cases relevant to professional services firms, care providers, and accountants who demand reliability and security.
You will find a comprehensive breakdown for each tool, including:
- Key Features: An honest look at what each platform does best.
- Pros & Cons: A balanced assessment of strengths and limitations.
- Pricing: A clear overview of their pricing tiers to help with budgeting.
- Suitability: Practical guidance on which type of organisation would benefit most.
We have included screenshots to give you a feel for the user interface and direct links for further exploration. This resource is organised to be your definitive guide for making an informed decision without wading through marketing jargon. For a different perspective and additional options, Adaptive Information Systems also provides an excellent guide to the top network performance monitoring tools for 2025. Let's examine the solutions that can help you maintain a robust and efficient network infrastructure.
1. SolarWinds – Network Performance Monitor (NPM)
SolarWinds Network Performance Monitor (NPM) is a comprehensive, self-hosted solution that has long been a cornerstone for IT professionals managing complex infrastructures. It provides deep visibility into the health and performance of multi-vendor network devices, making it one of the best network monitoring tools for organisations with hybrid on-premise and cloud environments. Its strength lies in its ability to go beyond simple uptime monitoring, offering detailed analysis of network paths and performance metrics to accelerate troubleshooting.
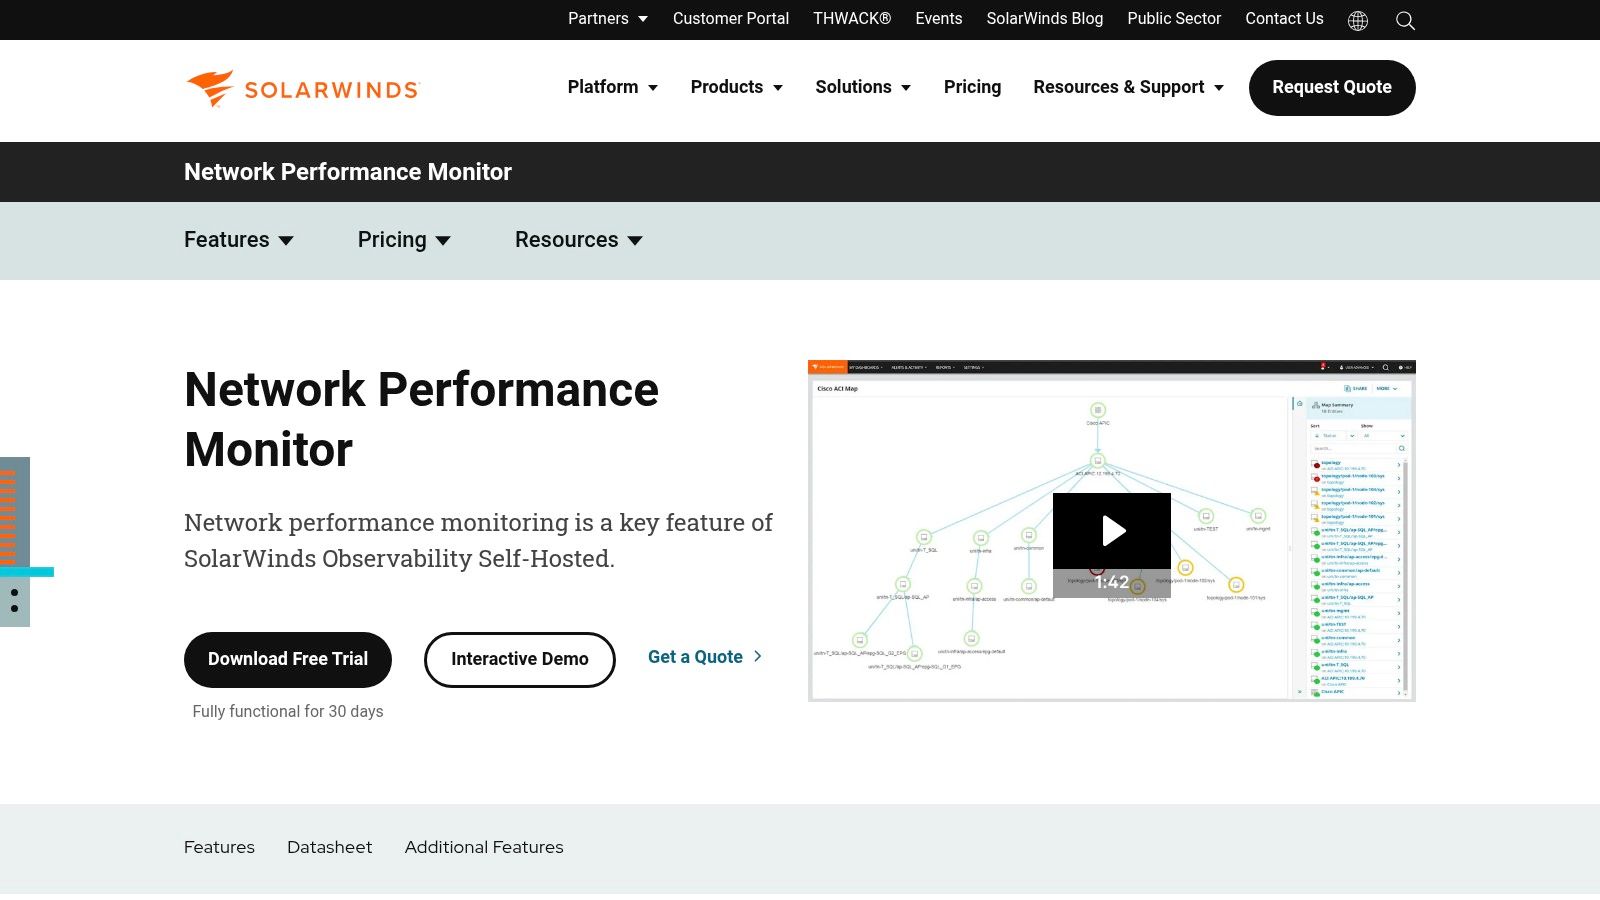
The platform is particularly well-suited for businesses in professional services, such as accounting or care providers, who require stable, behind-the-firewall monitoring to ensure service availability and data security. A practical example would be an accountancy practice in Wiltshire using NPM’s NetPath feature to visualise the exact network path a critical financial application takes. If performance degrades, they can instantly identify whether the bottleneck is an internal switch, the internet provider, or the application’s host, enabling rapid, evidence-based troubleshooting.
Key Features and Use Cases
- NetPath Visualisation: Provides a hop-by-hop analysis of network pathways, helping you identify and troubleshoot bottlenecks both inside and outside your network.
- PerfStack Correlation: Allows you to drag and drop performance metrics from various sources (network, servers, applications) onto a single timeline to correlate data and find the root cause of complex issues.
- Intelligent Alerting: The system uses advanced anomaly detection to reduce alert fatigue, notifying you only of genuine performance deviations rather than simple threshold breaches.
- Customisable Dashboards: Users can create tailored views and maps that show the health of critical services, which is essential for maintaining compliance and operational oversight.
Assessment and Pricing
| Aspect | Evaluation |
|---|---|
| Pros | Extensive multi-vendor device support, powerful diagnostic tools, and a large, active user community for support and shared knowledge. |
| Cons | Licensing can be complex to navigate, and the self-hosted model requires dedicated resources for maintenance and management. |
| Best For | Medium to large businesses with established IT teams needing in-depth, on-premise network diagnostics across a diverse hardware landscape. |
| Pricing | Available on a subscription or perpetual licence basis. Pricing is customised; a quote is required. A free 30-day trial is available. |
| Website | solarwinds.com/network-performance-monitor |
2. Paessler – PRTG Network Monitor
Paessler PRTG Network Monitor is a widely respected, all-in-one monitoring solution known for its simplicity and speed of deployment. It operates on a sensor-based model, offering a vast library of pre-configured sensors that can monitor everything from network devices and servers to applications and IoT hardware. This makes it one of the best network monitoring tools for small to medium-sized businesses that need comprehensive visibility without a steep learning curve or complex setup. It is available as a self-hosted (on-premise) solution or a cloud-hosted service, providing flexibility for different infrastructure strategies.

This tool is particularly valuable for organisations like a care provider in Hampshire, where IT staff may not be network specialists. For example, using PRTG's auto-discovery, the team can quickly map their entire network and apply default sensors to critical systems, such as VoIP phones and patient record servers. If a network switch goes offline, a simple, flexible alert can be sent directly to the on-call technician’s phone. This practical application ensures uptime for essential services, allowing even non-technical managers to understand system health at a glance from its single-pane-of-glass dashboards.
Key Features and Use Cases
- 250+ Pre-configured Sensor Types: PRTG offers a massive library of sensors for SNMP, WMI, packet sniffing, and more, allowing you to monitor virtually any device or system out of the box.
- Auto-Discovery: Automatically scans network segments to find and categorise devices, significantly reducing the manual effort required for initial setup.
- Single-Pane Dashboards and Maps: Create custom, real-time visual maps of your network that show the status of devices and the flow of data, helping you to understand how to monitor network traffic effectively.
- Flexible Alerts: Configure detailed notifications via email, SMS, or push notifications with custom thresholds and scheduling to avoid alert fatigue.
Assessment and Pricing
| Aspect | Evaluation |
|---|---|
| Pros | Quick deployment with a vast sensor catalogue, a generous free tier for up to 100 sensors, and excellent documentation with tutorials. |
| Cons | Sensor-based licensing can become complex and costly as the infrastructure scales, and it offers lighter AIOps features compared to some competitors. |
| Best For | Small to medium-sized businesses and mid-market enterprises looking for a powerful, user-friendly monitoring tool that offers fast time-to-value. |
| Pricing | Licensing is based on the number of sensors. A free version for 100 sensors is available. Paid plans are custom-quoted; a 30-day trial is offered. |
| Website | www.paessler.com/prtg/prtg-network-monitor |
3. Datadog – Network Monitoring
Datadog Network Monitoring is a cloud-native solution that excels in providing unified observability across complex, hybrid infrastructures. It integrates network performance data seamlessly with logs, metrics, and application traces, making it one of the best network monitoring tools for modern IT environments. Its key differentiator is the ability to correlate network health with application performance, offering a holistic view that is crucial for organisations running services across multiple cloud providers and on-premise data centres.
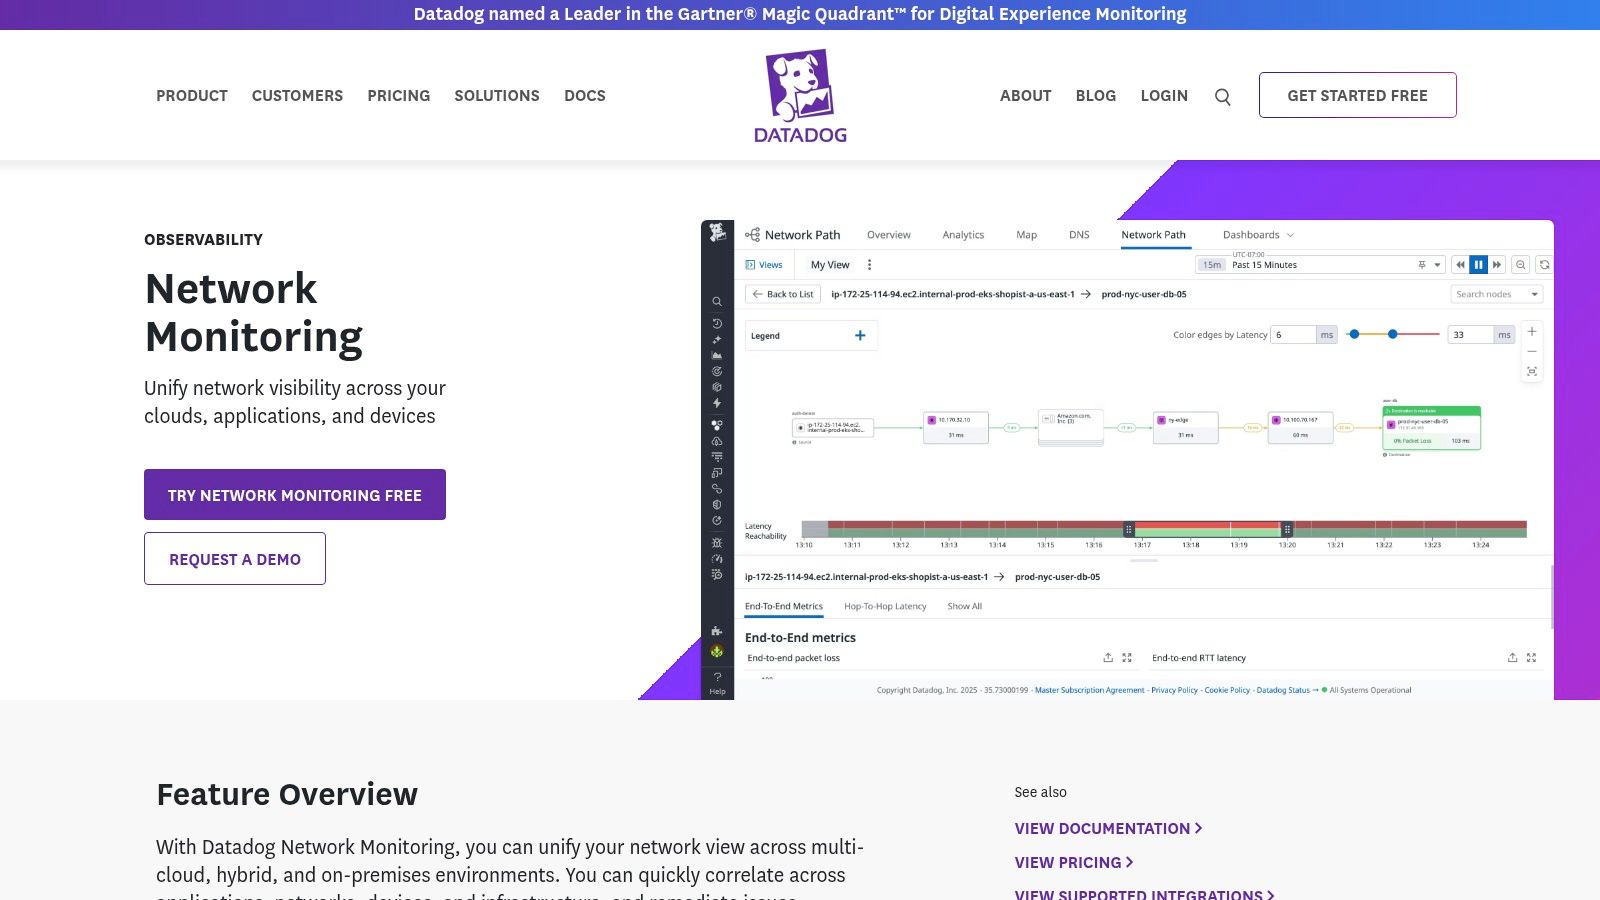
The platform is ideal for tech-forward businesses, such as a software development firm in Dorset that leverages containerised applications and multi-cloud services. A practical use case would be using Datadog’s unified tagging to trace a performance issue from a user-facing application right down to a specific container, a cloud security group, or an underperforming virtual network. This ability to connect disparate data points simplifies troubleshooting in highly dynamic environments, where traditional monitoring tools often fall short.
Key Features and Use Cases
- Unified Observability: Correlates network traffic data with application traces, logs, and infrastructure metrics to provide context-rich insights into performance issues.
- Hop-by-Hop Visualisation: Maps network paths and dependencies between services, containers, and cloud resources, helping to pinpoint latency and traffic bottlenecks.
- 850+ Integrations: Offers extensive pre-built integrations with cloud providers, services, and technologies, enabling quick and comprehensive data collection.
- NetFlow Analytics: Analyses traffic flows to identify which applications or services are consuming the most bandwidth and helps in optimising network resource allocation.
Assessment and Pricing
| Aspect | Evaluation |
|---|---|
| Pros | Excellent analytics and correlation across the full IT stack, scales effortlessly for cloud and containerised estates, and offers powerful dashboards. |
| Cons | The modular pricing model can become costly as usage expands, and the initial setup and instrumentation can be complex for teams new to the platform. |
| Best For | Cloud-native businesses and enterprises with hybrid environments that require deep integration between network, application, and infrastructure monitoring. |
| Pricing | Modular pricing based on hosts, devices, and data volume. A free 14-day trial is available to test the full platform. |
| Website | datadoghq.com/product/network-monitoring/ |
4. ManageEngine – OpManager
ManageEngine OpManager is a versatile, full-featured monitoring solution that caters to a wide spectrum of businesses, from small firms to large enterprises. It delivers robust monitoring capabilities for network devices, servers, and virtualised infrastructures using SNMP, WMI, and CLI protocols. This makes it one of the best network monitoring tools for organisations that require a single platform to gain visibility over their entire IT estate without the complexity of integrating multiple separate products.

The platform is particularly effective for professional services businesses like accountancy practices or care providers in regions like Dorset, who need a scalable and cost-effective tool. For instance, a growing care provider could use OpManager’s automatic Layer 2 network mapping to visualise their entire network topology as they add new locations. This practical feature helps them proactively manage bandwidth and ensure that critical systems for patient records and communications remain performant and reliable across all sites.
Key Features and Use Cases
- Multi-vendor Discovery and L2 Maps: Automatically discovers and maps all devices on your network, providing a clear topological view that simplifies asset management and troubleshooting.
- Real-time Performance and Fault Monitoring: Tracks key performance indicators like CPU, memory, and disk utilisation in real-time to identify potential issues before they impact end-users.
- Custom Dashboards and Reports: Offers highly customisable, drag-and-drop dashboards and over 100 built-in reports for performance analysis and compliance documentation.
- Alerting and Notifications: Provides a multi-level, threshold-based alerting system that can notify IT staff via email or SMS, ensuring swift responses to critical network events.
Assessment and Pricing
| Aspect | Evaluation |
|---|---|
| Pros | Competitive entry pricing and clear device-based licensing, making it accessible for SMEs. Works well for monitoring mixed Windows and Linux environments. |
| Cons | The UI depth can present a learning curve for new users. Add-ons for features like NetFlow or configuration management are often separate purchases. |
| Best For | Small to medium-sized businesses needing a comprehensive, all-in-one monitoring tool with a straightforward licensing model and strong multi-vendor support. |
| Pricing | Available via perpetual or subscription licences. The Standard Edition starts at around £195 for 10 devices. A 30-day free trial and a free edition are also available. |
| Website | manageengine.com/network-monitoring/index-common.html |
5. Zabbix
Zabbix is an enterprise-grade, open-source monitoring solution that offers immense flexibility for businesses that prefer to build and manage their own monitoring environment. As a completely free platform, it stands out as one of the best network monitoring tools for organisations with the technical expertise to deploy and customise it. It delivers comprehensive visibility across networks, servers, applications, and cloud services without any licensing fees, making it a powerful, budget-friendly option.
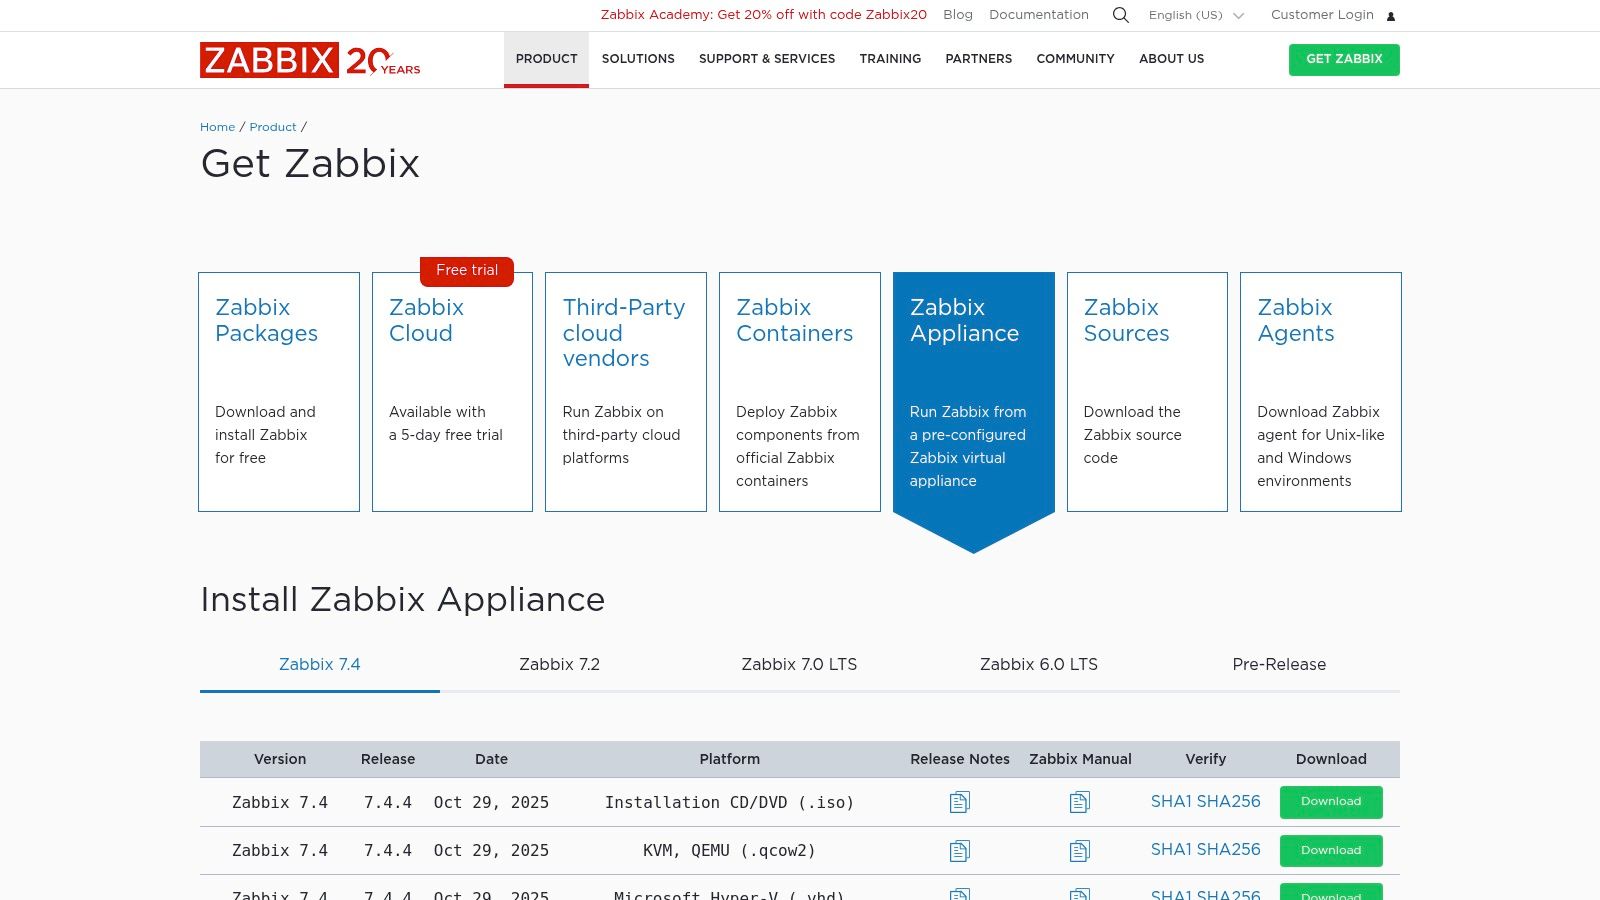
The platform is ideal for tech-savvy businesses, like a growing IT support firm in Dorset, that need a highly adaptable tool. A practical example is using Zabbix to monitor both their internal infrastructure and the diverse systems of their clients. They can use its templates to quickly deploy monitoring for standard hardware like routers and switches, while also creating custom scripts to check bespoke applications. This adaptability allows them to provide a proactive service without being constrained by vendor-specific limitations or costs.
Key Features and Use Cases
- Agent and Agentless Monitoring: Supports monitoring via Zabbix agents on hosts or using standard protocols like SNMP, ICMP, and JMX for network devices and applications.
- Auto-discovery: Automatically scans network segments or IP ranges to find and add new devices, applying predefined monitoring templates to streamline configuration.
- Flexible Alerting: Offers highly customisable alerting mechanisms, with support for multiple communication channels, escalation rules, and remediation actions.
- Templates and Dashboards: Provides a vast library of pre-built templates for common vendors and services, alongside powerful, customisable dashboards for data visualisation.
Assessment and Pricing
| Aspect | Evaluation |
|---|---|
| Pros | Completely free with no licensing fees, highly customisable, and backed by a strong community, with official commercial support available if needed. |
| Cons | Requires significant administrative expertise for initial setup, tuning, and ongoing maintenance. Enterprise-level features depend on careful configuration. |
| Best For | Businesses with skilled IT teams that require a powerful, no-cost, and highly customisable monitoring solution they can control and scale themselves. |
| Pricing | The software is free. Zabbix SIA offers optional paid support tiers, training, and consulting services. |
| Website | www.zabbix.com/download_appliance |
6. Nagios XI
Nagios XI is the commercial enterprise edition of the well-known Nagios Core, offering a powerful and highly extensible IT infrastructure monitoring solution. It is revered for its robust monitoring engine and its vast ecosystem of community-developed plug-ins, making it one of the most customisable and best network monitoring tools available. The platform provides a centralised view of your entire IT estate, from network switches and routers to servers and applications, all managed through a comprehensive graphical user interface.
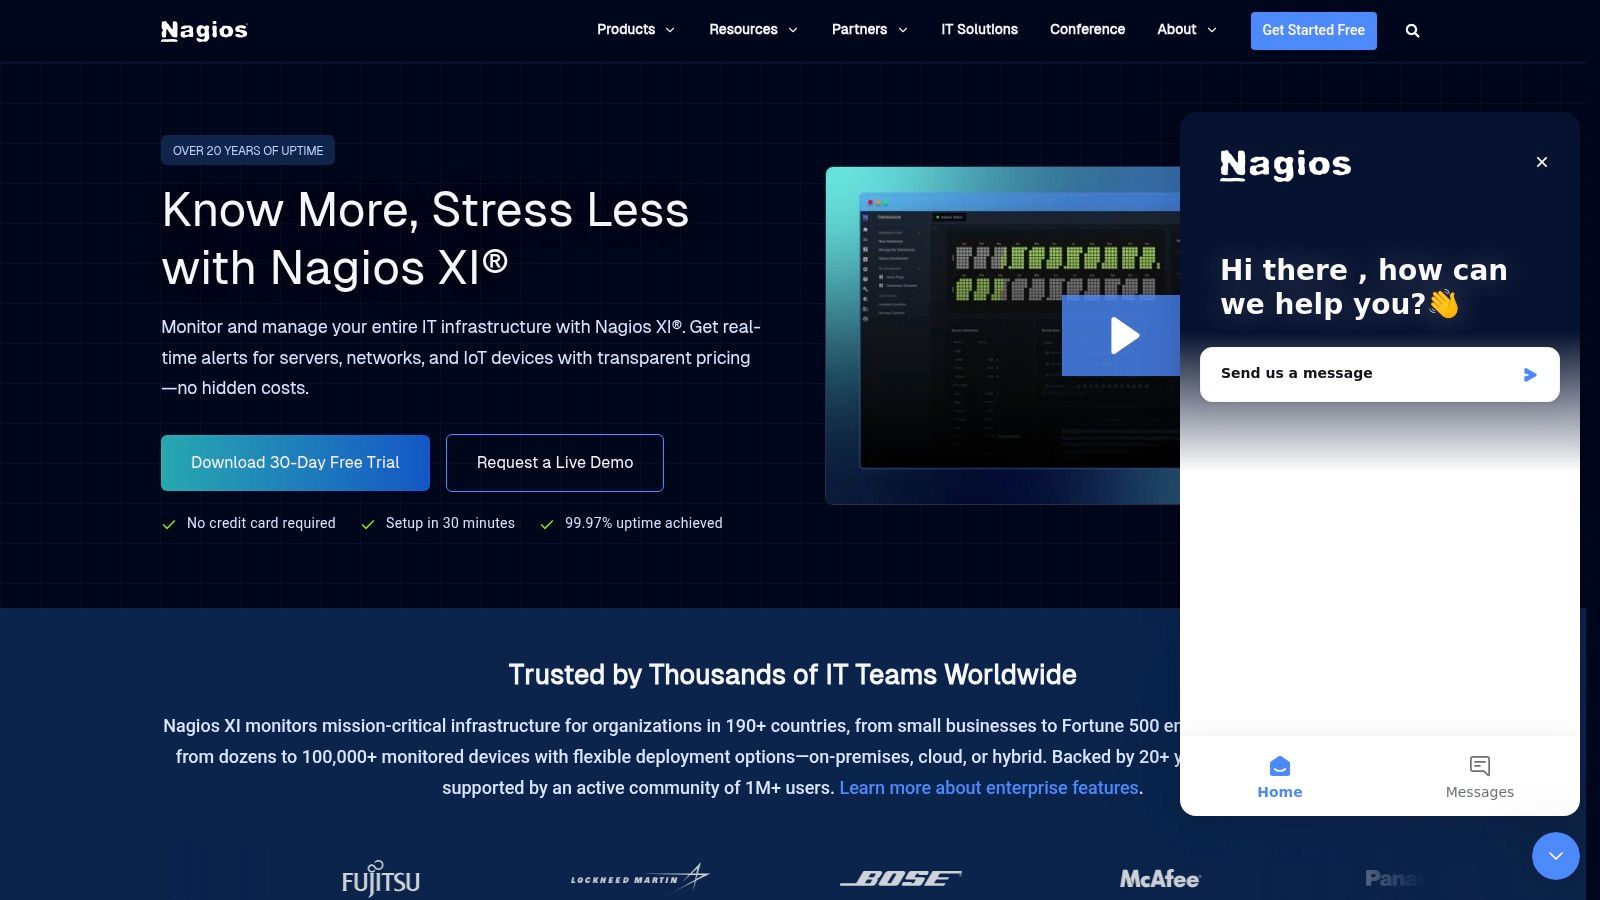
For a Dorset-based professional services firm managing sensitive client data, Nagios XI offers immense value. Its multi-tenant capabilities allow IT teams to create segmented views, ensuring that only authorised personnel can monitor specific systems related to particular clients, thus supporting data governance policies. A practical use case is creating custom scripts to monitor bespoke financial planning applications, ensuring critical service availability and performance around the clock for their high-value clientele.
Key Features and Use Cases
- Comprehensive Monitoring: Provides a complete overview of IT infrastructure components, including applications, services, operating systems, network protocols, and systems metrics.
- Configuration Wizards: Features over 65 easy-to-use configuration wizards that simplify the process of monitoring new devices, services, and applications with just a few clicks.
- Massive Plug-in Ecosystem: Leverages the Nagios Exchange, which hosts thousands of community-contributed add-ons and plug-ins to monitor virtually any type of hardware or software.
- Capacity Planning and Reporting: Advanced reporting tools help organisations plan for infrastructure upgrades and generate Service Level Agreement (SLA) reports to track performance against key business objectives.
Assessment and Pricing
| Aspect | Evaluation |
|---|---|
| Pros | Highly extensible with a vast plug-in library from Nagios Exchange, multi-tenant capabilities for segmented access, and a strong, long-standing reputation in IT operations. |
| Cons | The user interface can feel dated in certain areas, and optimising the configuration for very large, complex environments can require significant technical expertise. |
| Best For | Organisations with skilled IT teams that require a highly customisable, on-premise monitoring solution capable of adapting to unique and diverse technological environments. |
| Pricing | Offered in Standard and Enterprise editions with tiered pricing based on the number of nodes. A free, fully functional 30-day trial is available. |
| Website | nagios.com/products/nagios-xi/ |
7. LogicMonitor – LM Envision
LogicMonitor’s LM Envision is a fully SaaS-based observability platform that delivers comprehensive network monitoring without the overhead of self-hosting. Its strength lies in its extensive integrations and automated discovery, making it one of the best network monitoring tools for businesses seeking a unified view of hybrid IT environments. The platform combines network performance data with logs and cloud metrics, all enhanced by its AIOps engine, Edwin AI, to provide intelligent, actionable insights.

This solution is ideal for professional services firms, such as a multi-site care provider group in Dorset, that need to monitor network devices, cloud services, and critical applications from a single pane of glass. A practical example is using its automated topology mapping. An IT manager could instantly visualise how a network outage at one care home impacts connected VoIP systems and patient management software hosted in Azure. This immediate context accelerates troubleshooting and helps maintain essential service delivery.
Key Features and Use Cases
- Extensive Integrations: With over 3,000 pre-built integrations, the platform offers automated discovery and monitoring for a vast range of devices, cloud services, and applications.
- Automated Topology Mapping: Dynamically generates and updates network maps, providing a clear visualisation of device relationships and data flows to speed up root cause analysis.
- Edwin AI Intelligence: The built-in AIOps engine helps reduce alert noise by correlating events, detecting anomalies, and predicting potential issues before they impact users.
- Sandbox and Remote Sessions: Provides a secure environment for testing configurations and allows for secure, audited remote access to devices for troubleshooting directly from the platform.
Assessment and Pricing
| Aspect | Evaluation |
|---|---|
| Pros | Clear tiering with published entry-level pricing. The platform scales effectively and is supported by strong customer success programmes. |
| Cons | Certain features and data retention periods are tied to specific pricing tiers. The hybrid-unit pricing model requires careful planning to map device counts. |
| Best For | Medium-sized businesses and enterprises needing a scalable, all-in-one SaaS observability solution for complex hybrid and cloud-native infrastructures. |
| Pricing | Offered in two main tiers, Pro and Enterprise, with pricing based on a hybrid unit model. Published pricing starts from £22 per device/month. |
| Website | www.logicmonitor.com/pricing |
8. Auvik
Auvik is a cloud-based (SaaS) network management and monitoring platform designed for speed and simplicity, making it a popular choice among Managed Service Providers (MSPs) and internal IT teams. It excels at providing rapid, comprehensive visibility across a network with minimal deployment effort. Its core strength is its ability to automatically discover, map, and begin monitoring network devices within minutes, removing the setup friction common with more traditional, self-hosted solutions.

This makes it one of the best network monitoring tools for organisations that need immediate insights without a lengthy configuration project. For example, a care provider group in Hampshire could deploy Auvik across its multiple sites to instantly map all network-connected devices, including medical equipment and VoIP phones. This real-time topology map would help their lean IT team quickly identify connectivity issues affecting patient care systems. This is a practical way to ensure operational continuity with limited on-site resources.
Key Features and Use Cases
- Automated Discovery and Live Topology: Automatically discovers all network devices and creates a real-time, Layer 1 to Layer 3 map, simplifying asset inventory and troubleshooting.
- Pre-configured Alerts and Traffic Insights: Comes with over 50 pre-configured alerts for common network issues and uses NetFlow/sFlow data to show which applications are consuming bandwidth.
- Policy and Configuration Backup: Automatically backs up configurations for supported switches, routers, and firewalls, allowing for quick restoration and change tracking.
- MSP-Friendly Multi-Tenant Model: Designed from the ground up for MSPs, it offers a centralised dashboard to manage multiple client networks securely and efficiently.
Assessment and Pricing
| Aspect | Evaluation |
|---|---|
| Pros | Extremely fast deployment and minimal maintenance overhead. The multi-tenant architecture is ideal for MSPs and lean IT teams needing quick visibility. |
| Cons | Pricing is quote-based and its per-device licensing model is not public. Advanced analytics may be lighter than top-tier enterprise suites. |
| Best For | MSPs and small to medium-sized businesses with limited IT staff who need a powerful, low-maintenance solution for immediate network visibility. |
| Pricing | Quote-based pricing. Auvik offers a free 14-day trial to test its functionality. |
| Website | www.auvik.com |
9. Progress – WhatsUp Gold
Progress WhatsUp Gold is a well-established, on-premise network monitoring tool known for its straightforward approach and operational clarity. It provides powerful discovery, mapping, and monitoring capabilities, making it one of the best network monitoring tools for organisations that prefer a self-hosted solution with a clear, predictable licensing model. Its strength lies in providing essential at-a-glance visibility into the health of network devices, servers, and applications without overwhelming users with unnecessary complexity.

The platform is particularly effective for businesses in professional services, such as a solicitor's office in Dorset, that require reliable core monitoring to ensure client data is always accessible. A practical use case would be using its automatic discovery and topology maps to get an immediate, accurate visualisation of their entire network. This would help them quickly identify a failing switch or overloaded server that could impact access to their case management system, demonstrating the direct cause-and-effect visibility crucial for maintaining operational uptime.
Key Features and Use Cases
- Automatic Discovery & Mapping: Automatically discovers all connected devices on your network and generates interactive Layer 2/3 topology maps for a complete visual overview.
- Availability & Performance Monitoring: Delivers real-time monitoring of device status, resource utilisation (CPU, memory), and overall performance to pre-emptively address issues.
- Customisable Alerts: Offers flexible and customisable alerting to notify IT staff of issues via SMS, email, or web alarms, ensuring critical problems are addressed promptly.
- Optional Add-On Modules: Functionality can be extended with modules for Network Traffic Analysis (NTA), Configuration Management, and Log Management to create a more comprehensive solution.
Assessment and Pricing
| Aspect | Evaluation |
|---|---|
| Pros | A straightforward user interface that is easy to learn, and the availability of perpetual licences offers an alternative to subscription-only models. |
| Cons | Lacks a primary focus on advanced AIOps or deep cloud observability, and the modular pricing can become complex when multiple add-ons are required. |
| Best For | Small to medium-sized businesses needing a robust, on-premise tool for core network performance monitoring with a simple, visual-first approach. |
| Pricing | Offered via subscription or perpetual licence. Pricing is tier-based on device count and required modules; a customised quote is necessary. A free trial is available. |
| Website | whatsupgold.com/pricing |
10. Cisco ThousandEyes
Cisco ThousandEyes is an industry leader in internet and digital experience monitoring, providing unparalleled visibility beyond the corporate network perimeter. Unlike traditional tools focused on internal infrastructure, ThousandEyes uses a global network of monitoring points to trace application and service delivery paths across the internet. This makes it one of the best network monitoring tools for modern businesses reliant on SaaS, cloud services, and a distributed workforce. Its strength is in diagnosing issues outside of your direct control.

The platform is ideal for organisations where external service performance is critical. For example, a Hampshire-based professional services firm using a cloud-hosted client relationship management (CRM) system. If staff report sluggishness, ThousandEyes can determine if the issue stems from the local office internet, a regional ISP peering problem, or the SaaS provider’s own infrastructure. This hop-by-hop visibility provides the evidence needed to hold third-party vendors accountable and speed up resolution.
Key Features and Use Cases
- Path Visualisation: Provides a detailed, hop-by-hop map of traffic flows from your users to any application, pinpointing performance degradation across ISP, cloud, and SaaS provider networks.
- Internet Insights: Delivers a macro-level view of global internet outages, allowing IT teams to correlate internal issues with broader events affecting major service providers.
- Network and Application Synthetics: Proactively tests the availability and performance of websites, APIs, and critical services from various global vantage points to identify problems before users are impacted.
- BGP and DNS Visibility: Monitors Border Gateway Protocol (BGP) routes and DNS resolution to detect hijacks, misconfigurations, or other issues that could disrupt service accessibility.
Assessment and Pricing
| Aspect | Evaluation |
|---|---|
| Pros | Exceptional visibility into external networks, ISPs, and SaaS providers. Its extensive global monitoring points and deep enterprise integrations are unmatched. |
| Cons | The enterprise-focused pricing and complex licensing model can be a significant investment. It may be excessive for smaller sites with simple network needs. |
| Best For | Medium to large enterprises that depend heavily on SaaS, SASE, and cloud services and need to guarantee the digital experience for a hybrid workforce. |
| Pricing | Pricing is based on a consumption model (units) and is customised based on usage. A quote is required. A 15-day free trial is available. |
| Website | thousandeyes.com |
11. Kentik – Network Intelligence Platform
Kentik offers a powerful SaaS-based network observability platform designed for organisations managing large, complex networks. It excels at analysing high-volume flow data (NetFlow, sFlow, IPFIX) alongside synthetic monitoring, providing a unified view of performance across hybrid cloud, data centre, and internet pathways. Its strength lies in turning vast amounts of traffic data into actionable intelligence, making it one of the best network monitoring tools for service providers and enterprises with significant digital footprints.

The platform is particularly valuable for businesses that rely heavily on internet connectivity and cloud services, such as a growing tech company in Hampshire. Such a firm could use Kentik to analyse peering relationships with internet service providers, optimise traffic routes for their SaaS application, and proactively detect and mitigate DDoS attacks that could disrupt client access. This deep visibility into external network performance is a practical necessity for ensuring a high-quality user experience and planning for future capacity needs.
Key Features and Use Cases
- High-Scale Flow Analytics: Ingests and analyses billions of flow records to provide granular insights into traffic patterns, application usage, and capacity planning.
- Unified Observability: Combines network performance monitoring (NPM), synthetic testing, and DDoS protection into a single, integrated platform.
- Service Provider Optimisation: Delivers specialised tools for analysing BGP routes, peering agreements, and interconnect traffic to improve performance and reduce costs.
- Cloud Visibility: Extends monitoring into AWS, Azure, and Google Cloud, offering a complete picture of network traffic and performance from the data centre to the cloud.
Assessment and Pricing
| Aspect | Evaluation |
|---|---|
| Pros | Best-in-class flow analytics capable of handling massive scale, providing unparalleled traffic visibility. The platform offers transparent starter pricing for its 'Pro' plan, which is rare in this market segment. |
| Cons | Advanced features and enterprise-level plans require annual contracts and can become costly. The platform's comprehensive feature set may be overly complex for very small businesses with straightforward network monitoring needs. |
| Best For | Internet service providers, SaaS companies, and medium to large enterprises that require deep, real-time visibility into high-volume network traffic across complex hybrid and multi-cloud environments. |
| Pricing | The 'Pro' plan starts at a published price, with customised pricing for 'Premier' and 'Enterprise' tiers. A free 30-day trial is available to test the platform. |
| Website | kentik.com/product/plans-pricing |
12. Amazon Web Services – CloudWatch Network Monitor
For organisations deeply embedded in the AWS ecosystem, CloudWatch Network Monitor offers native visibility into hybrid network performance. It consolidates several monitoring capabilities to track the health of network paths between AWS resources and on-premise data centres. As one of the best network monitoring tools for cloud-centric businesses, it excels at providing latency and packet loss metrics without needing third-party agents for many AWS-to-AWS connections, simplifying deployment significantly.
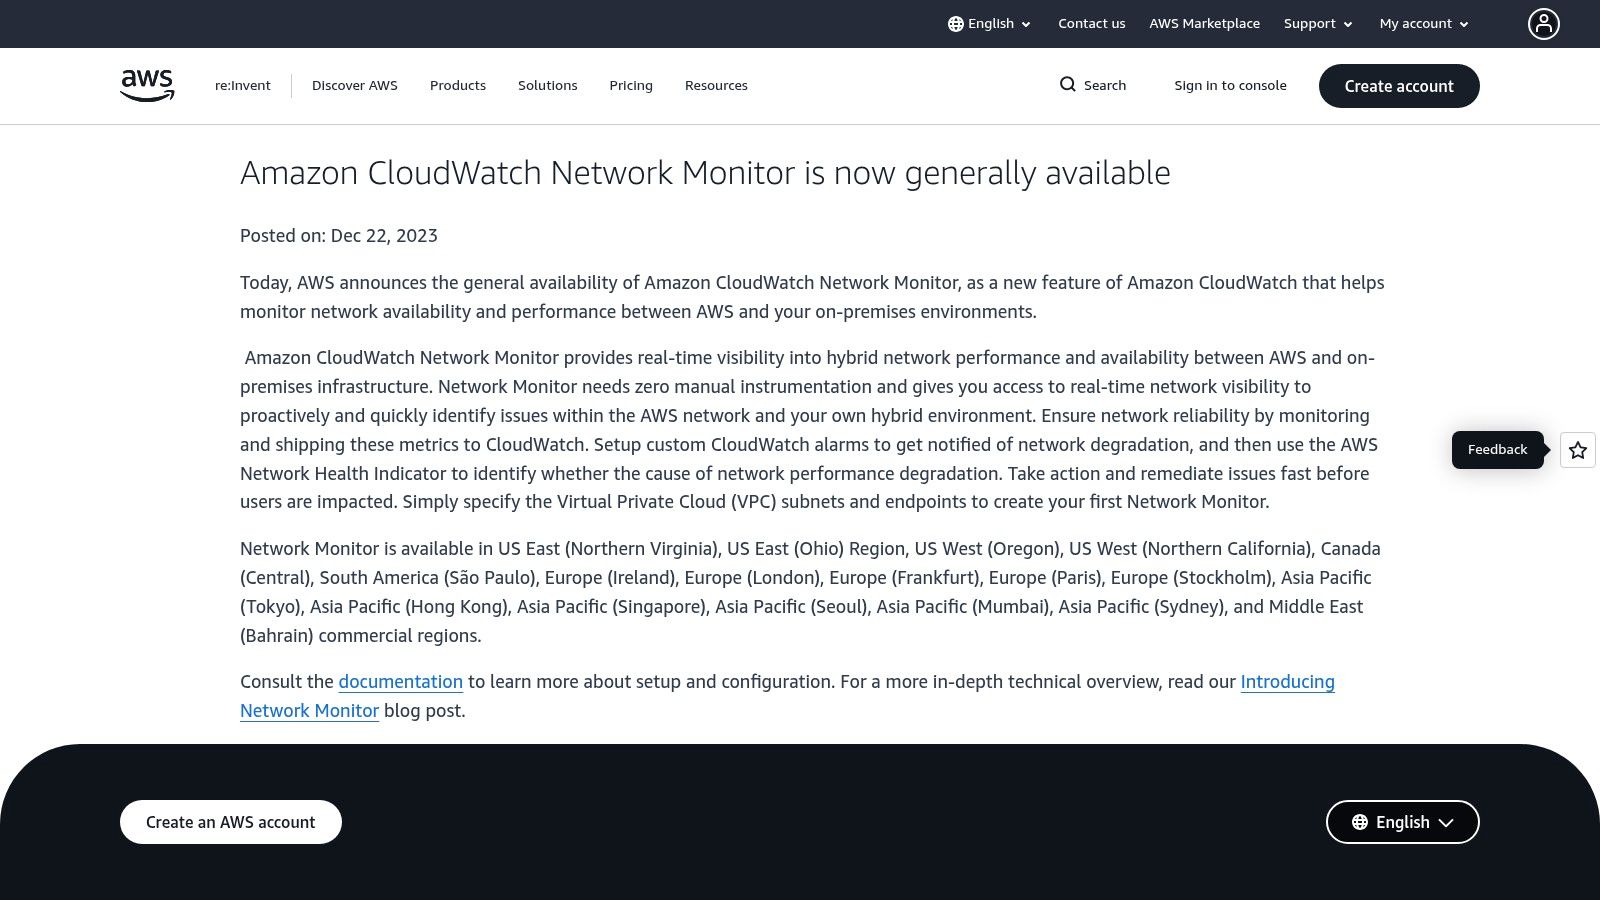
This tool is highly practical for businesses that operate hybrid models. For instance, a professional services firm in Hampshire using an on-premise client database that communicates with cloud applications in AWS. They could use CloudWatch Network Monitor's synthetic monitors to proactively test the connection between their local office and their AWS Virtual Private Cloud (VPC). This ensures critical data synchronisation is never compromised, and its tight integration with CloudWatch alarms allows for immediate notifications if performance degrades.
Key Features and Use Cases
- Passive Flow Monitors: Automatically measures packet loss and round-trip latency between AWS workloads, such as across different VPCs or Availability Zones.
- Synthetic Monitors: Allows you to create probes that actively monitor network paths between on-premise infrastructure and your AWS environment for hybrid connectivity health checks.
- Internet Monitors: Provides visibility into the performance of the internet path between your end-users and your applications hosted on AWS.
- CloudWatch Integration: Natively integrates with CloudWatch dashboards and alarms, allowing you to centralise monitoring data and automate alerting based on performance baselines.
Assessment and Pricing
| Aspect | Evaluation |
|---|---|
| Pros | Seamless integration with the AWS ecosystem, offers data residency in UK regions like London, and features a pay-as-you-go model that avoids upfront costs. |
| Cons | Primarily focused on AWS workloads with limited traditional, device-level network discovery for on-premise hardware. The pricing model can be complex to forecast. |
| Best For | Businesses of any size that heavily utilise AWS services and require a native tool for monitoring hybrid cloud network connectivity and application paths. |
| Pricing | Billed on a pay-as-you-go basis. Costs depend on the number of monitors, city-networks, and processed flow records. A free tier is available. |
| Website | aws.amazon.com/cloudwatch/network-monitor |
Top 12 Network Monitoring Tools — Feature & Performance Comparison
| Solution | Core features | User experience & scalability | Value proposition / USP | Target audience | Pricing & deployment |
|---|---|---|---|---|---|
| SolarWinds – Network Performance Monitor (NPM) | NetPath, PerfStack, intelligent maps, alerting (on‑prem) | Mature, deep device/vendor coverage; large admin community | Strong for multi‑vendor, behind‑the‑firewall root‑cause and topology analysis | On‑prem enterprise IT teams and mixed vendor estates | Self‑hosted footprint; complex Orion/Observability licensing |
| Paessler – PRTG Network Monitor | 250+ sensors, auto‑discovery, single‑pane dashboards, flexible alerts | Fast time‑to‑value; well‑documented and approachable | Broad prebuilt sensor library for quick monitoring coverage | SMBs to mid‑enterprise and IT teams needing rapid deployment | Sensor‑based licensing (can grow costly); on‑prem or hosted |
| Datadog – Network Monitoring | Hop‑by‑hop views, NetFlow analytics, unified tagging, 850+ integrations | Excellent cross‑stack analytics and correlation; cloud/container scale | Unified observability (APM, logs, network) for hybrid cloud | DevOps and cloud teams running multi‑cloud/containerised apps | SaaS, modular pricing that can add up as usage grows |
| ManageEngine – OpManager | SNMP/WMI/CLI discovery, L2 maps, real‑time monitoring, reports | Competitive entry pricing; solid mixed Windows/Linux support; UI has learning curve | Clear device‑based model and flexible licensing (perpetual/sub) | SMBs to enterprises needing device‑centric monitoring | Per‑device licensing; optional add‑ons (NetFlow, config mgmt) |
| Zabbix | Agent & agentless monitoring, SNMP/traps, templates, dashboards | Highly customisable and community‑driven; requires admin expertise | No licence fees and extensive configurability | Teams with in-house expertise or cost‑sensitive organisations | Open‑source (free); optional paid support; self‑hosted |
| Nagios XI | Core monitoring + thousands of plugins, config wizards, reporting | Extremely extensible via plugins; familiar to ops teams; legacy UI areas | Huge plugin ecosystem and flexible integrations | Ops teams needing extensible, multi‑tenant monitoring | Commercial licensing; tuning needed for very large estates |
| LogicMonitor – LM Envision | 3,000+ integrations, topology, anomaly detection, Edwin AI | SaaS scale with strong customer success; clear tiering | Modern AIOps and transparent hybrid‑unit pricing model | Enterprises and MSPs seeking SaaS observability | SaaS; published entry prices; feature/retention vary by tier |
| Auvik | Automated discovery, live topology, pre‑configured alerts, config backup | Very fast deployment, low maintenance, MSP‑friendly multi‑tenant UX | Quick visibility and easy management for lean teams | MSPs and small IT teams needing immediate visibility | SaaS, quote‑based per‑device pricing (not public) |
| Progress – WhatsUp Gold | Auto‑discovery, topology, availability/perf, optional NTA/config modules | Straightforward UI for core NPM; familiar workflows | Simple core NPM with perpetual licence option | Organisations needing basic NPM without deep observability | Perpetual and subscription options; optional modules extra |
| Cisco ThousandEyes | Global agents, BGP/DNS visibility, path viz, synthetics, Internet Insights | Exceptional external and SaaS visibility at global scale | Best‑in‑class internet/SaaS/ISP monitoring and global PoPs | Enterprises, SASE projects and SaaS‑heavy organisations | Enterprise‑oriented SaaS pricing; premium cost |
| Kentik – Network Intelligence Platform | High‑scale NetFlow/IPFIX analytics, synthetics, DDoS, capacity planning | Designed for very large/hybrid networks; strong flow analytics | Service‑provider grade flow intelligence and peering insights | Service providers and large enterprises with heavy flow needs | SaaS with published Pro starter pricing; annual contracts |
| AWS – CloudWatch Network Monitor | Flow monitors, synthetics, internet monitors, CloudWatch integration (eu‑west‑2) | Native AWS UX, pay‑as‑you‑go; best for AWS‑centric architectures | Tight AWS integration and UK data residency options | AWS workloads and hybrid AWS‑to‑on‑prem visibility needs | Pay‑as‑you‑go; complex flow/record pricing and AWS focus |
Final Thoughts
Navigating the landscape of the best network monitoring tools can feel overwhelming, especially for small and medium-sized businesses in Dorset, Somerset, and Wiltshire where every investment must deliver tangible value. As we've explored, the "best" tool isn't a one-size-fits-all solution; it's the one that aligns precisely with your organisation's unique infrastructure, technical expertise, and strategic objectives.
Our detailed review of tools from SolarWinds NPM to AWS CloudWatch reveals a clear spectrum. On one end, you have comprehensive, enterprise-grade platforms like SolarWinds, LogicMonitor, and Cisco ThousandEyes, which offer profound depth and extensive integrations but often come with a steeper learning curve and higher cost. On the other, open-source powerhouses like Zabbix and Nagios XI provide unparalleled customisation and cost-effectiveness, provided you have the in-house technical resources to deploy and maintain them effectively.
Key Takeaways for Your Selection Process
For many SMEs, particularly in professional services sectors like accountancy or care provision, the sweet spot often lies with solutions like Paessler PRTG, ManageEngine OpManager, or Auvik. These platforms strike an excellent balance between powerful, out-of-the-box functionality, user-friendly interfaces, and predictable pricing models. PRTG's sensor-based pricing is particularly appealing for businesses that want to start small and scale, while Auvik's automated discovery and mapping capabilities can save an immense amount of time for teams without a dedicated network engineer.
When making your final decision, move beyond the feature checklists and consider these critical, practical factors:
- Implementation Overhead: How much time and expertise will it take to get the tool running effectively? A feature-rich tool is useless if it's too complex to configure correctly. For instance, a small accountancy firm in Hampshire would likely benefit more from Auvik's rapid deployment than from a lengthy Zabbix implementation project.
- Total Cost of Ownership (TCO): Look beyond the initial licence fee. Factor in costs for training, dedicated personnel, hardware resources (for on-premises solutions), and potential add-on modules. An open-source tool might be "free," but the staff hours required to manage it constitute a very real cost.
- Scalability and Future-Proofing: Your business will grow. Does the tool's architecture and pricing model support this growth? Consider how a tool like Datadog or LogicMonitor, with its cloud-native focus, might better support a future transition to cloud-based services compared to a strictly on-premises solution.
- Alerting and Reporting: Effective network monitoring is not just about data collection; it's about actionable insights. Evaluate the quality of the alerting engine. Can it reduce alert fatigue? Are the reporting features flexible enough to provide meaningful performance data to both technical teams and non-technical management?
Your Actionable Next Steps
The journey to optimised network performance begins with a clear understanding of your current environment and future needs. Don't simply choose the most popular tool. Instead, shortlist two or three candidates from our list that seem to fit your profile. Take full advantage of the free trials they offer.
Use this trial period to test the tools against your real-world challenges. Can it monitor that crucial legacy application? Does it give you clear visibility into your VoIP call quality? How intuitive is the dashboard for your team? Answering these questions with hands-on experience is the most reliable way to select one of the best network monitoring tools for your specific operational context, ensuring it becomes a genuine asset for security, efficiency, and growth.
Navigating these complex technical decisions and implementing the right solution can be a significant challenge. SES Computers specialises in providing managed IT services, including the deployment and management of network monitoring systems, to businesses across Dorset and the surrounding counties. Let our experts help you select and implement the perfect tool to ensure your network is a stable, secure, and powerful foundation for your business.